When the Free Raisins had been playing for ~3.5 years I put together a set of charts showing how booking had worked for us. Since it's now been another 3.5y I thought I'd make some updated charts.
Here's a chart showing when we booked each gig, and how long from then until we played it:
Image may be NSFW.
Clik here to view.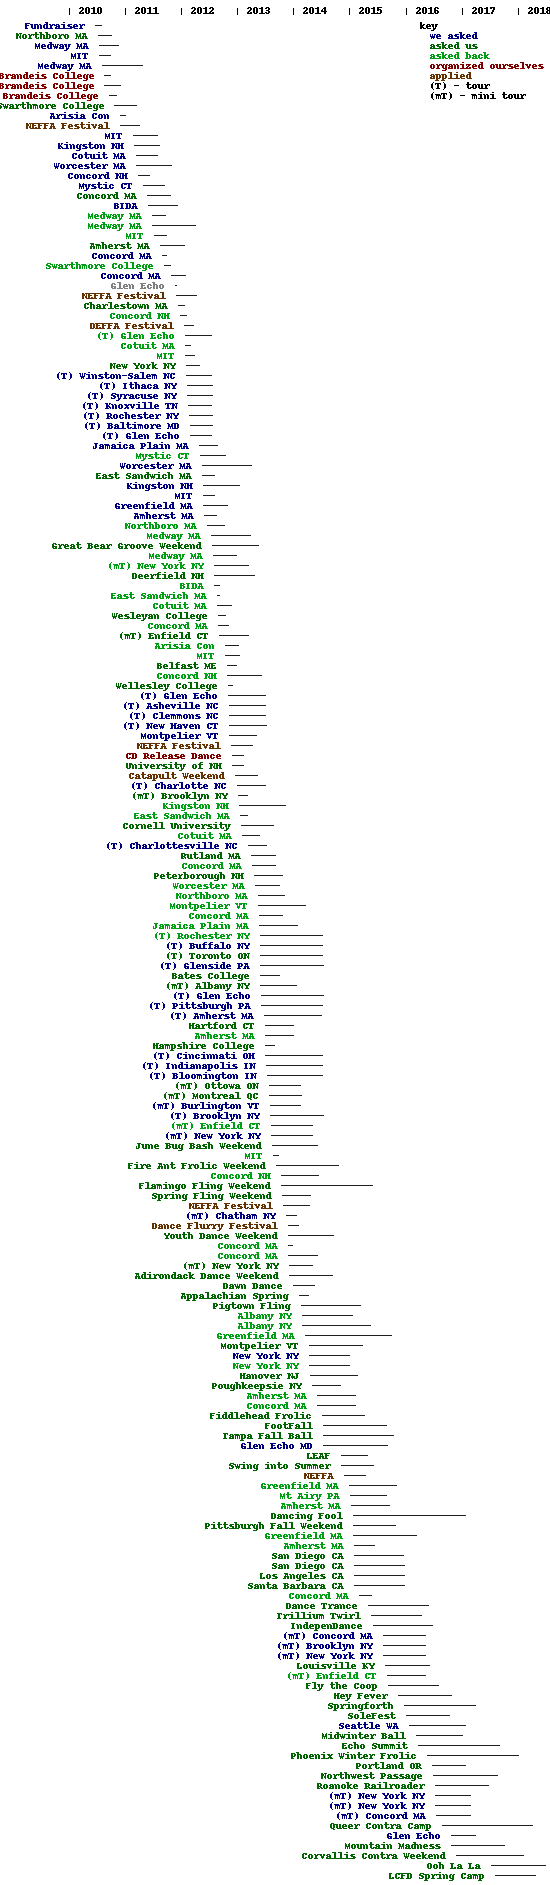
(While this is accurate for bookings through today it doesn't show the full picture for gigs because we might still get booked for something on shorter notice.)
I also made a chart showing how often we asked for gigs (blue), vs were asked (red), vs put together a tour (green):
Image may be NSFW.
Clik here to view.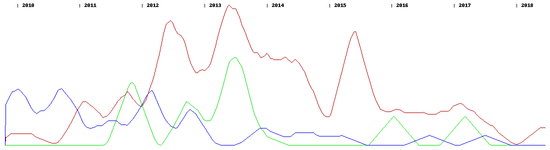
One big change is that since we now live on two coasts and in three states we can pretty much only take gigs if they're willing to fly us, which mostly just means dance weekends. We also haven't organized a substantial tour since the summer 2014 one, because I can't be away from my family that long. On the other hand, we're still playing a bunch because each booking now typically corresponds to ~4x the amount of playing that it did when we were playing single evenings.
(As before, the code and raw data is on github. If I hadn't uploaded it in 2013 I doubt I would have had the code around, and I definitely wouldn't have put in the time now to redo it.)
Comment via: google plus, facebook